How to use Dashboard
The Dashboard offers several features that make it easier to get a snapshot of your data at any given time.
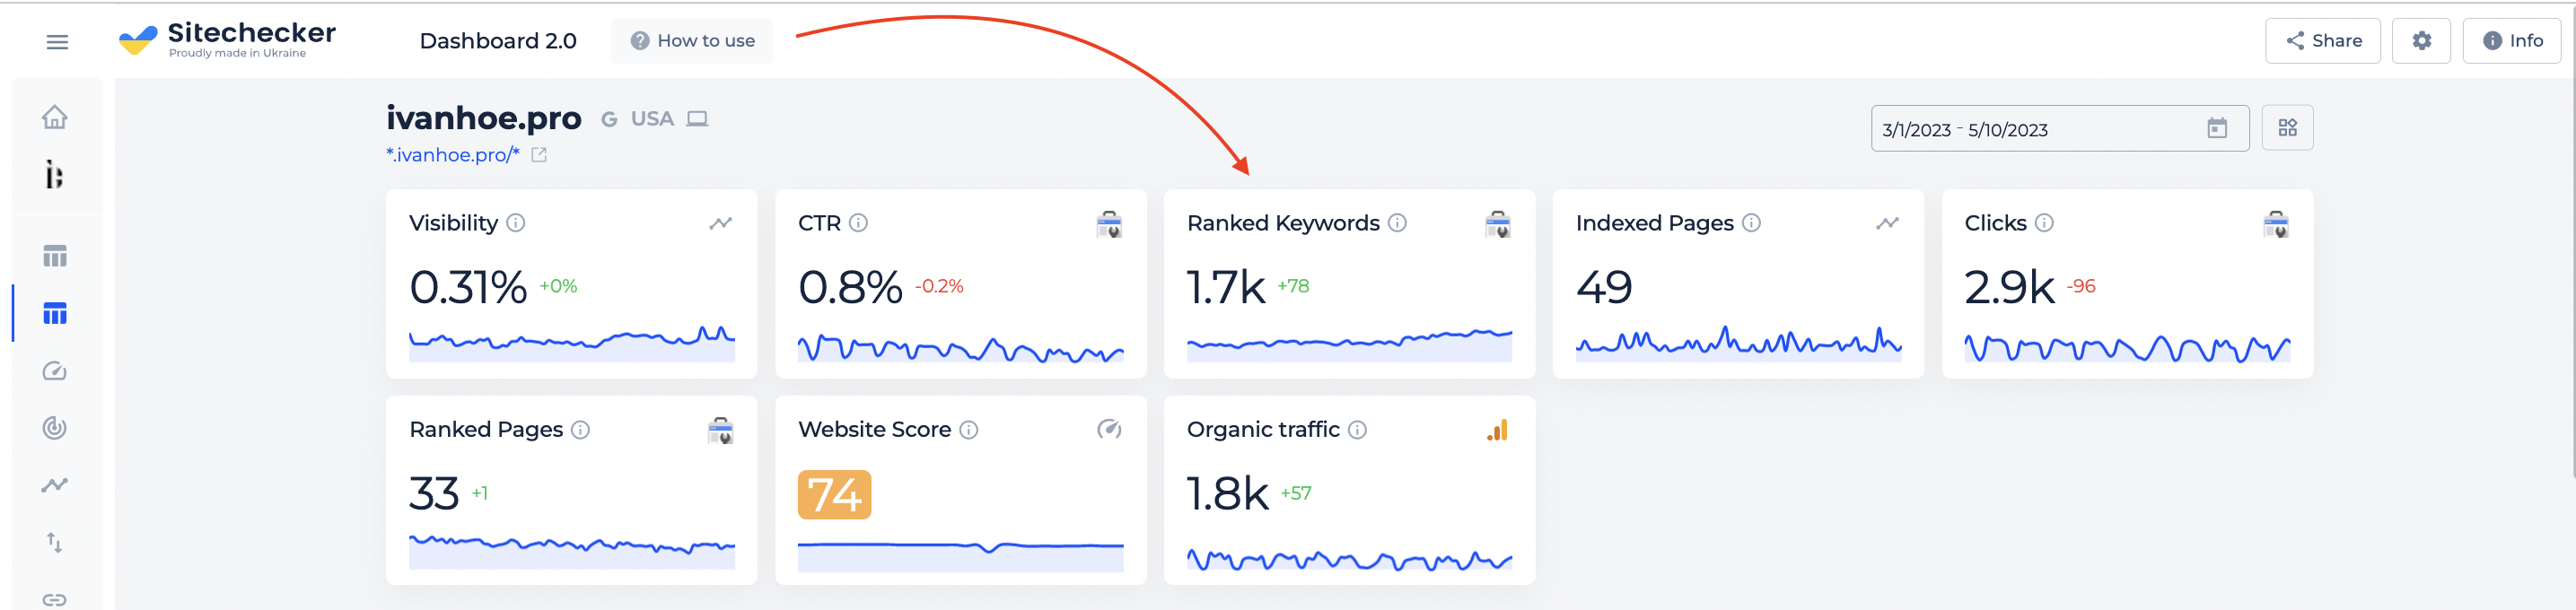
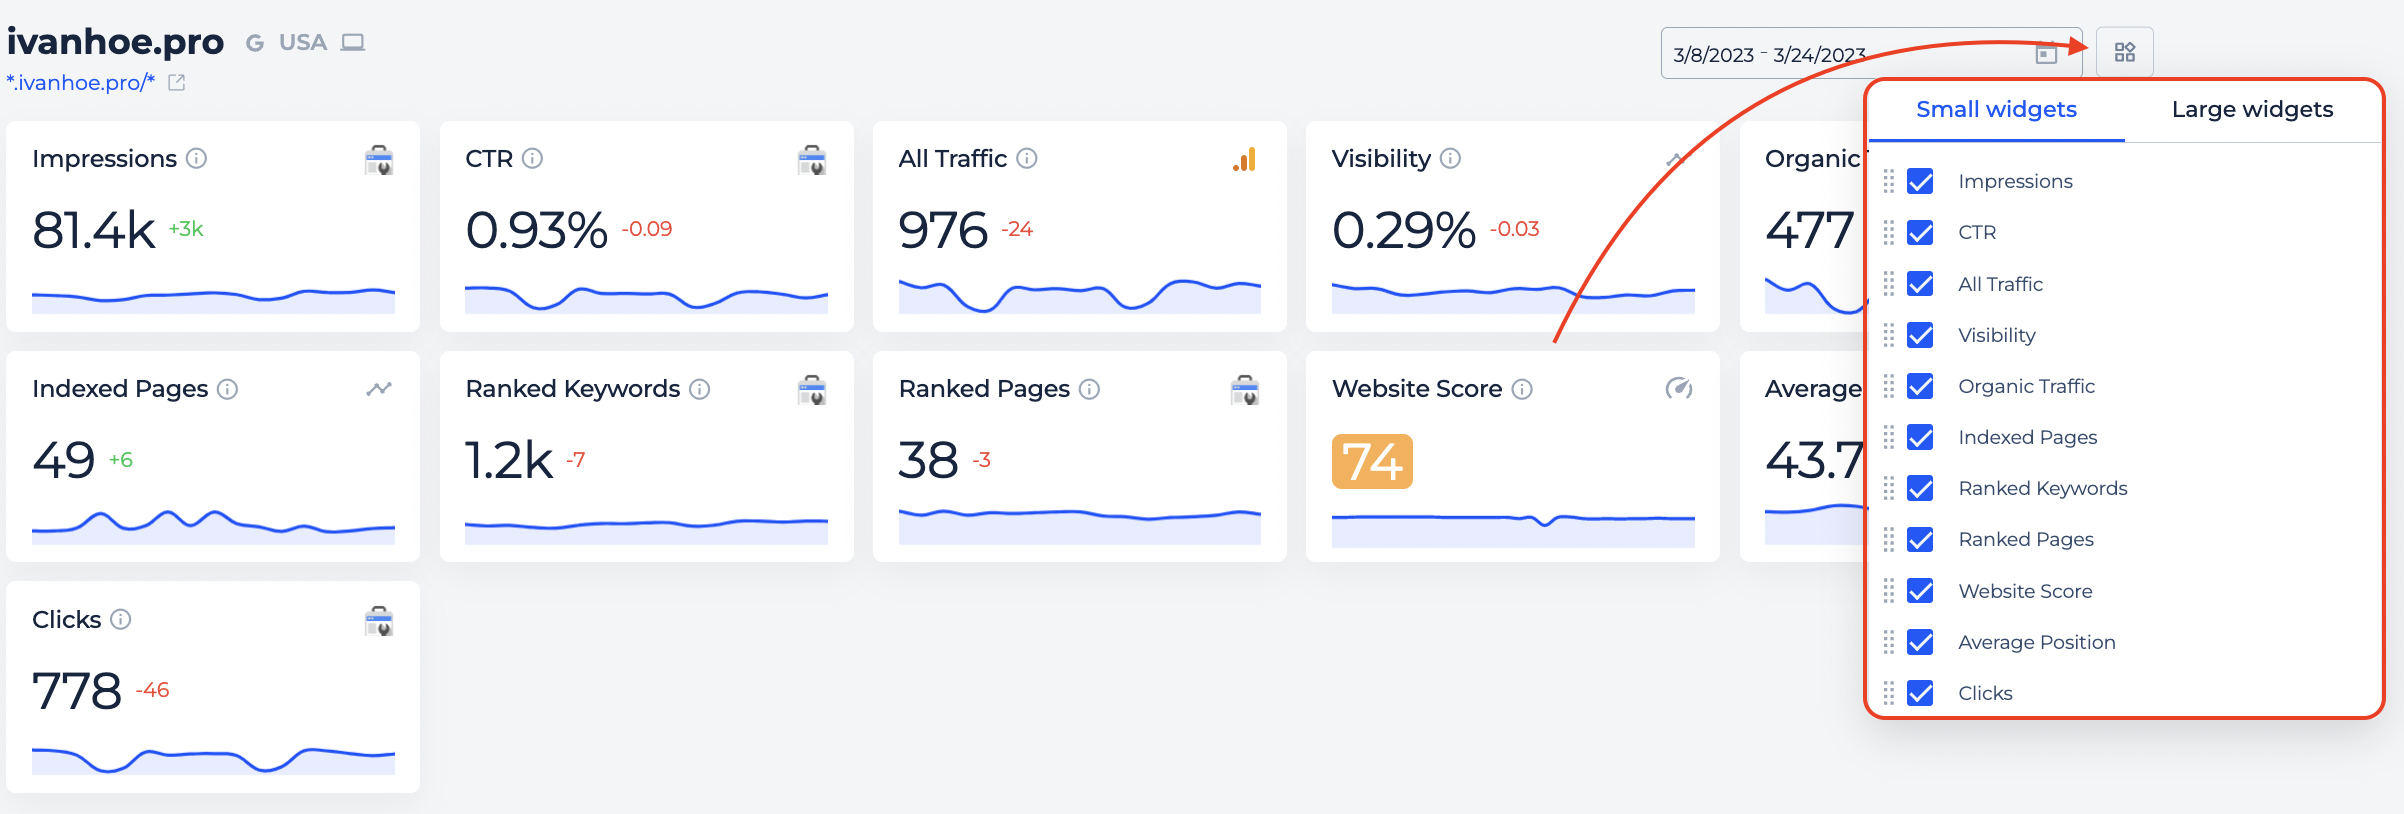
Widgets
Now you can easily toggle between different metrics without having to search through multiple tabs.
-
Small widgets will allow you to quickly access specific metrics from sources like Google Analytics, Google Search Console, Site Audit, Rank Tracker, and Site Monitoring tools.
-
Large widgets meanwhile give you more precise data from different tools, so that you can quickly assess how your business is doing overall. We hope this improved version of our dashboard will help to make life easier for our customers and allow them to better track their performance over time!
It is also possible to move the tabs inside the large widgets to prioritize your work with them.
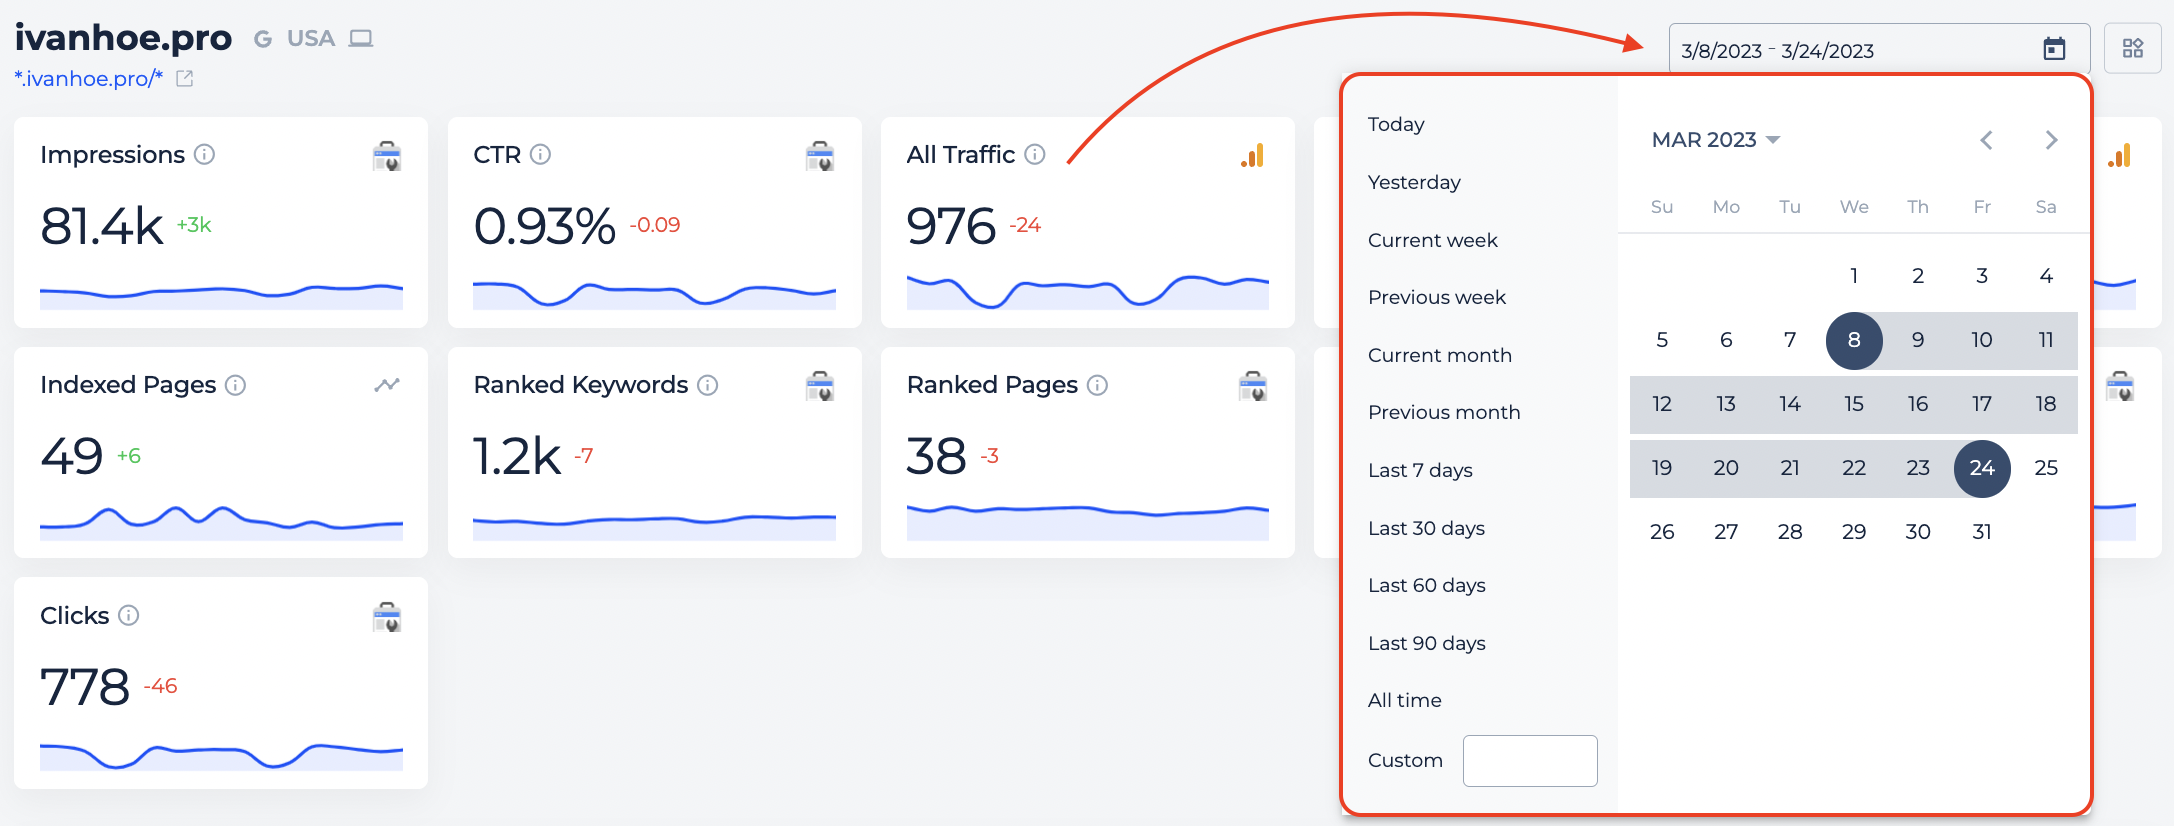
Historical data
With the new Dashboard, you can now access your Google Analytics and Google Search Console historical data. Just click on the calendar and set the dates you want to check the information for. In case we have this data for our internal tools, we will also show it on the Dashboard for the selected period accordingly.
If there is a data comparison, we compare the selected data with the previous analogical period.
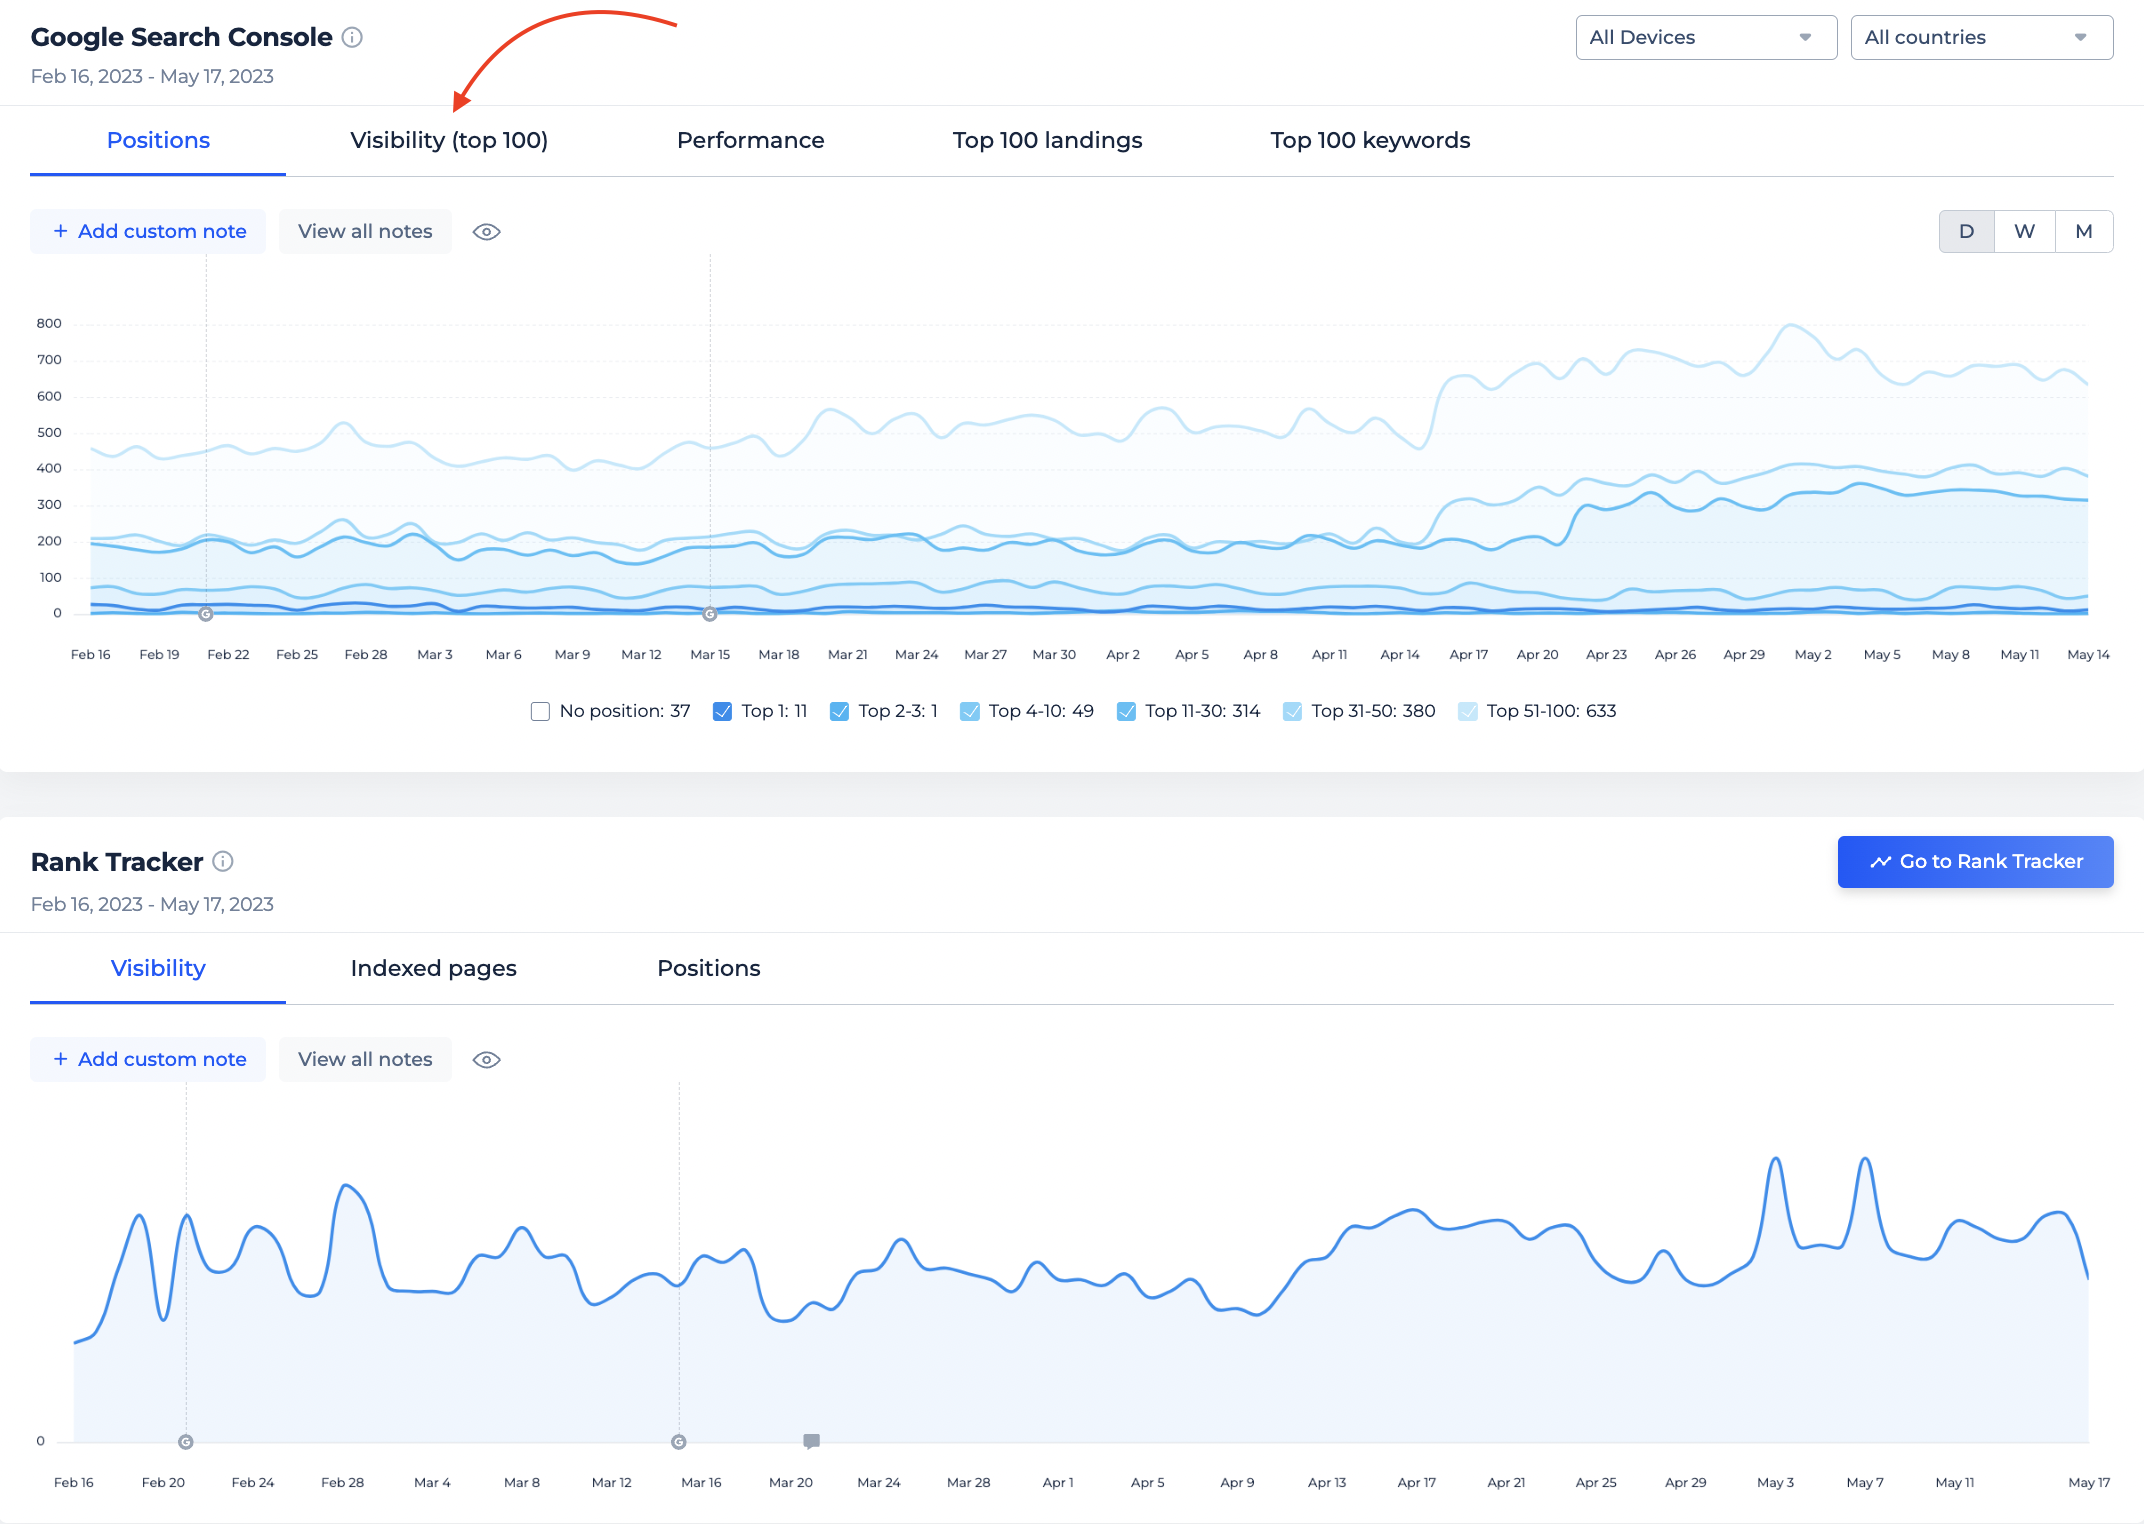
Detailed integrations from GA and GSC
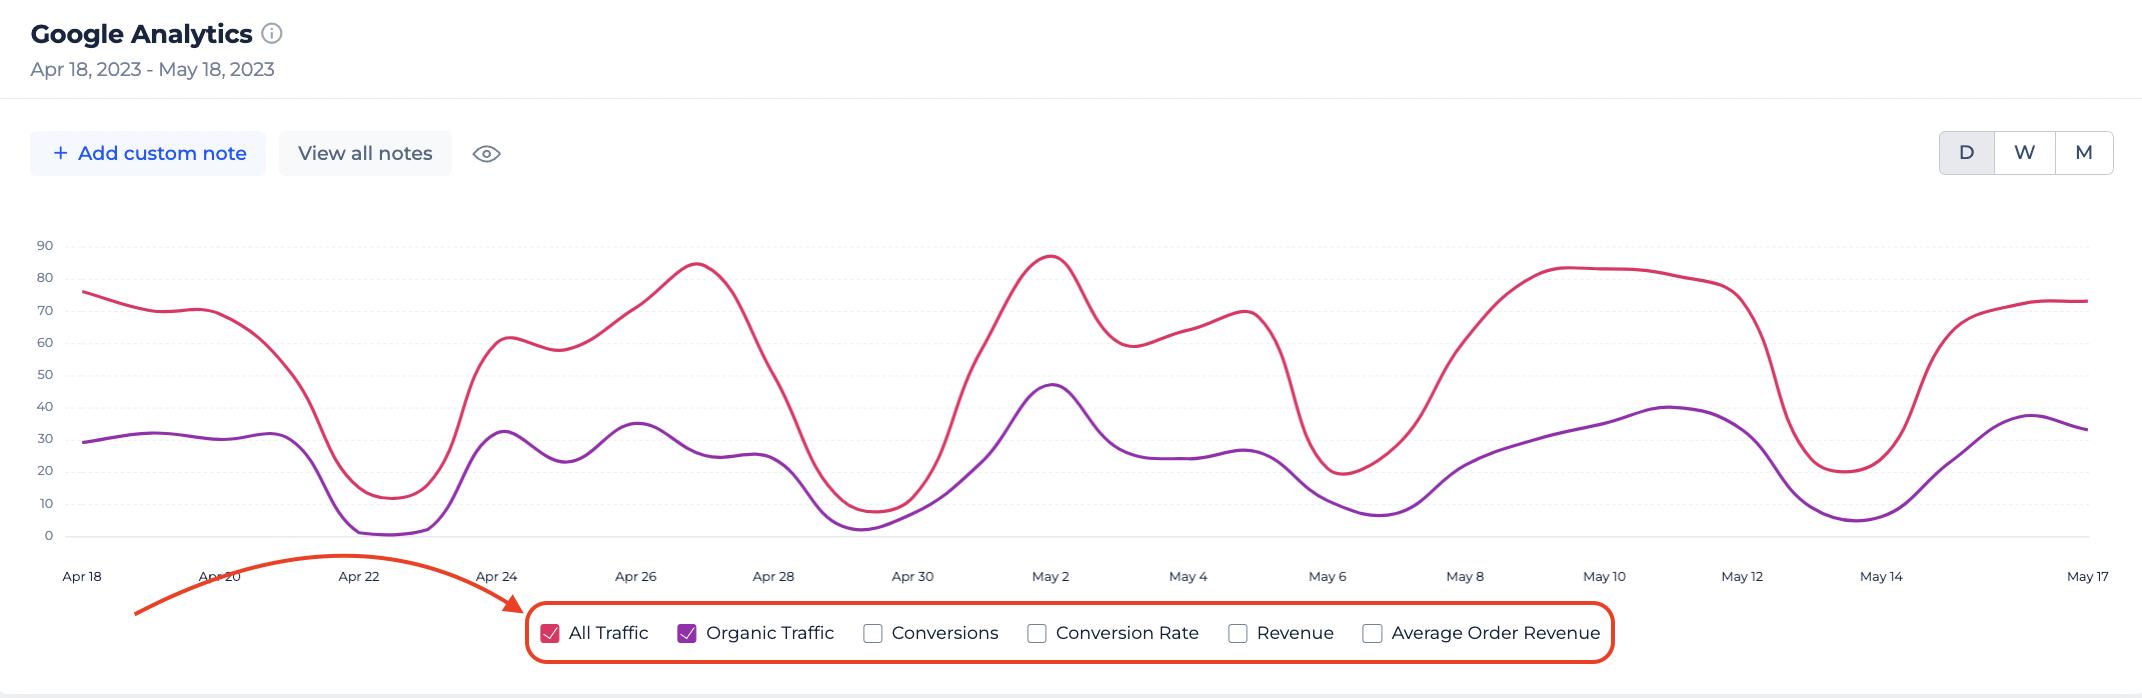
Both widgets will provide you with the information integrated from Google Analytics and Google Search Console. This will allow you to take a birds-eye view of all the main statistics.
-
Google Analytics widget has the following metrics you can visualize on the graph (All Traffic, Organic Traffic, Conversions, Conversion Rate, Revenue, Average Order Revenue).
-
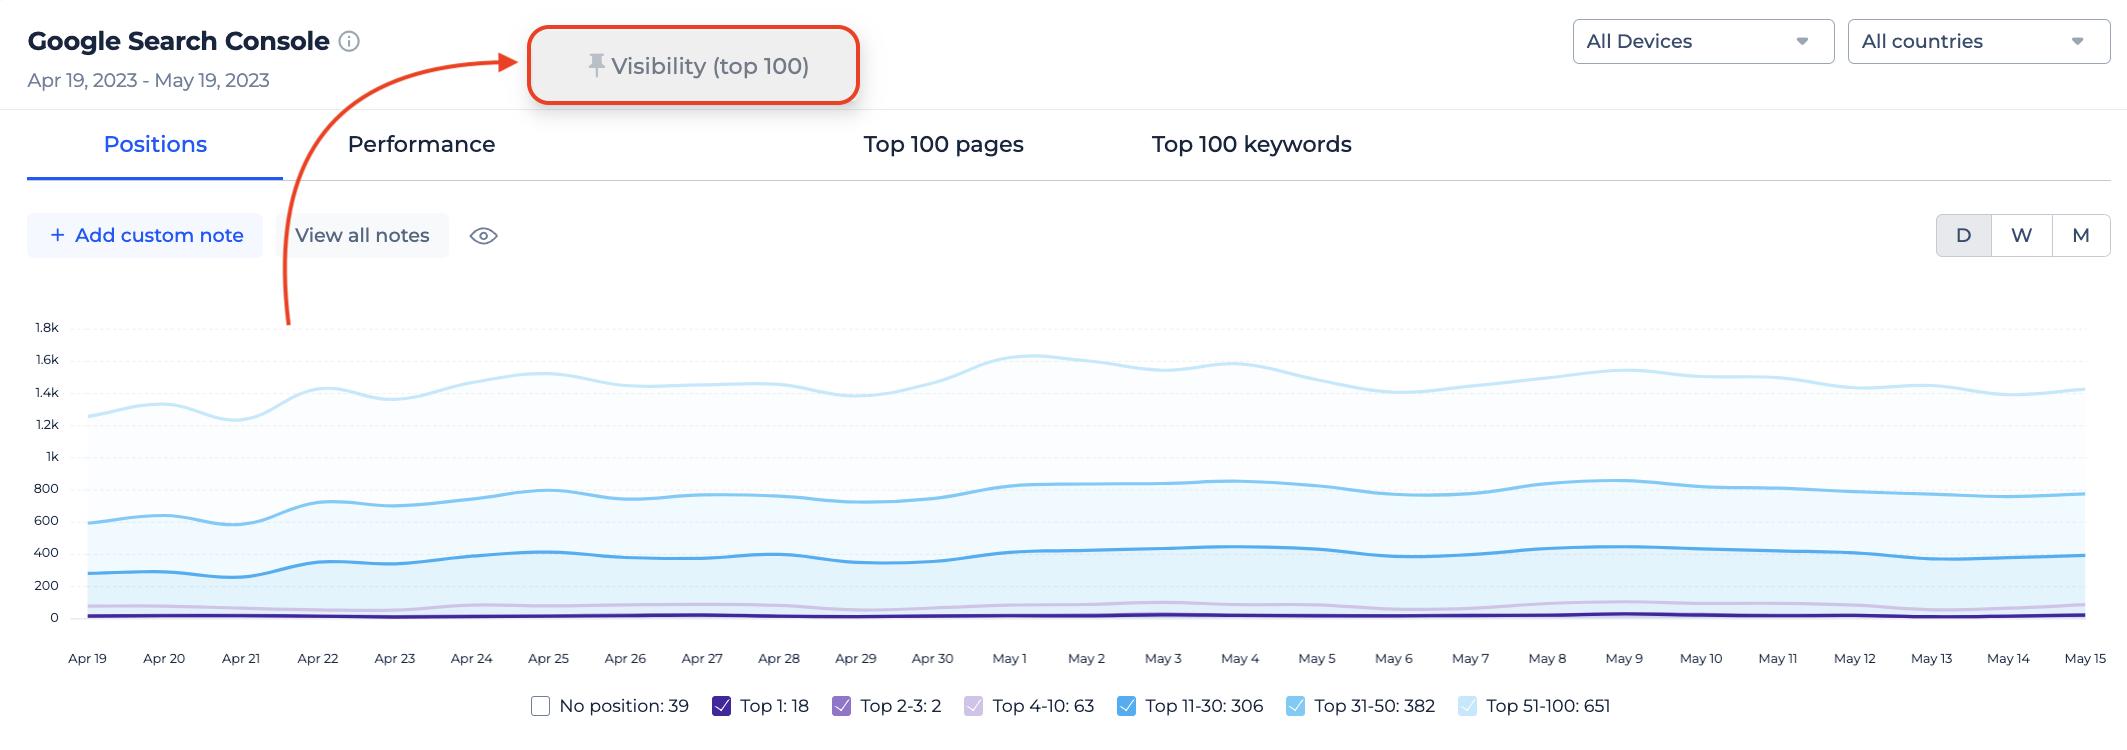
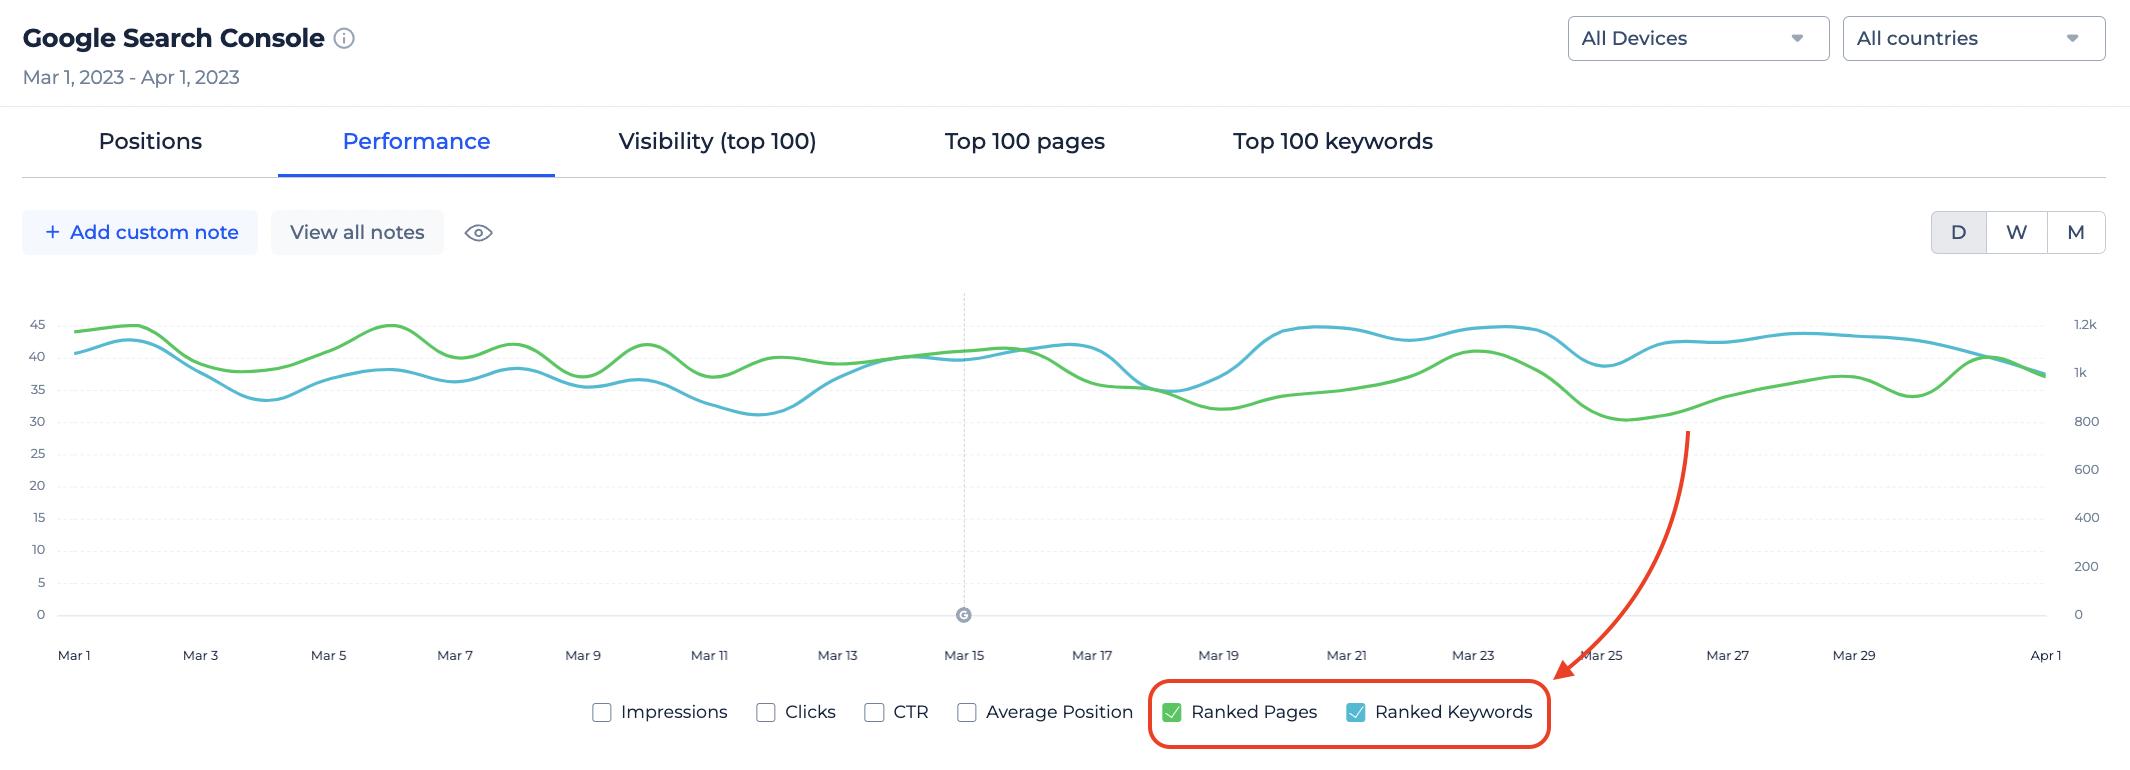
Google Search Console widget has even its own tabs you can switch between to deep dive into more insights (Positions, Visibility (top 100), Performance, Top 100 pages, Top 100 keywords). In this widget, you can even filter the data by visitors’ device and country.
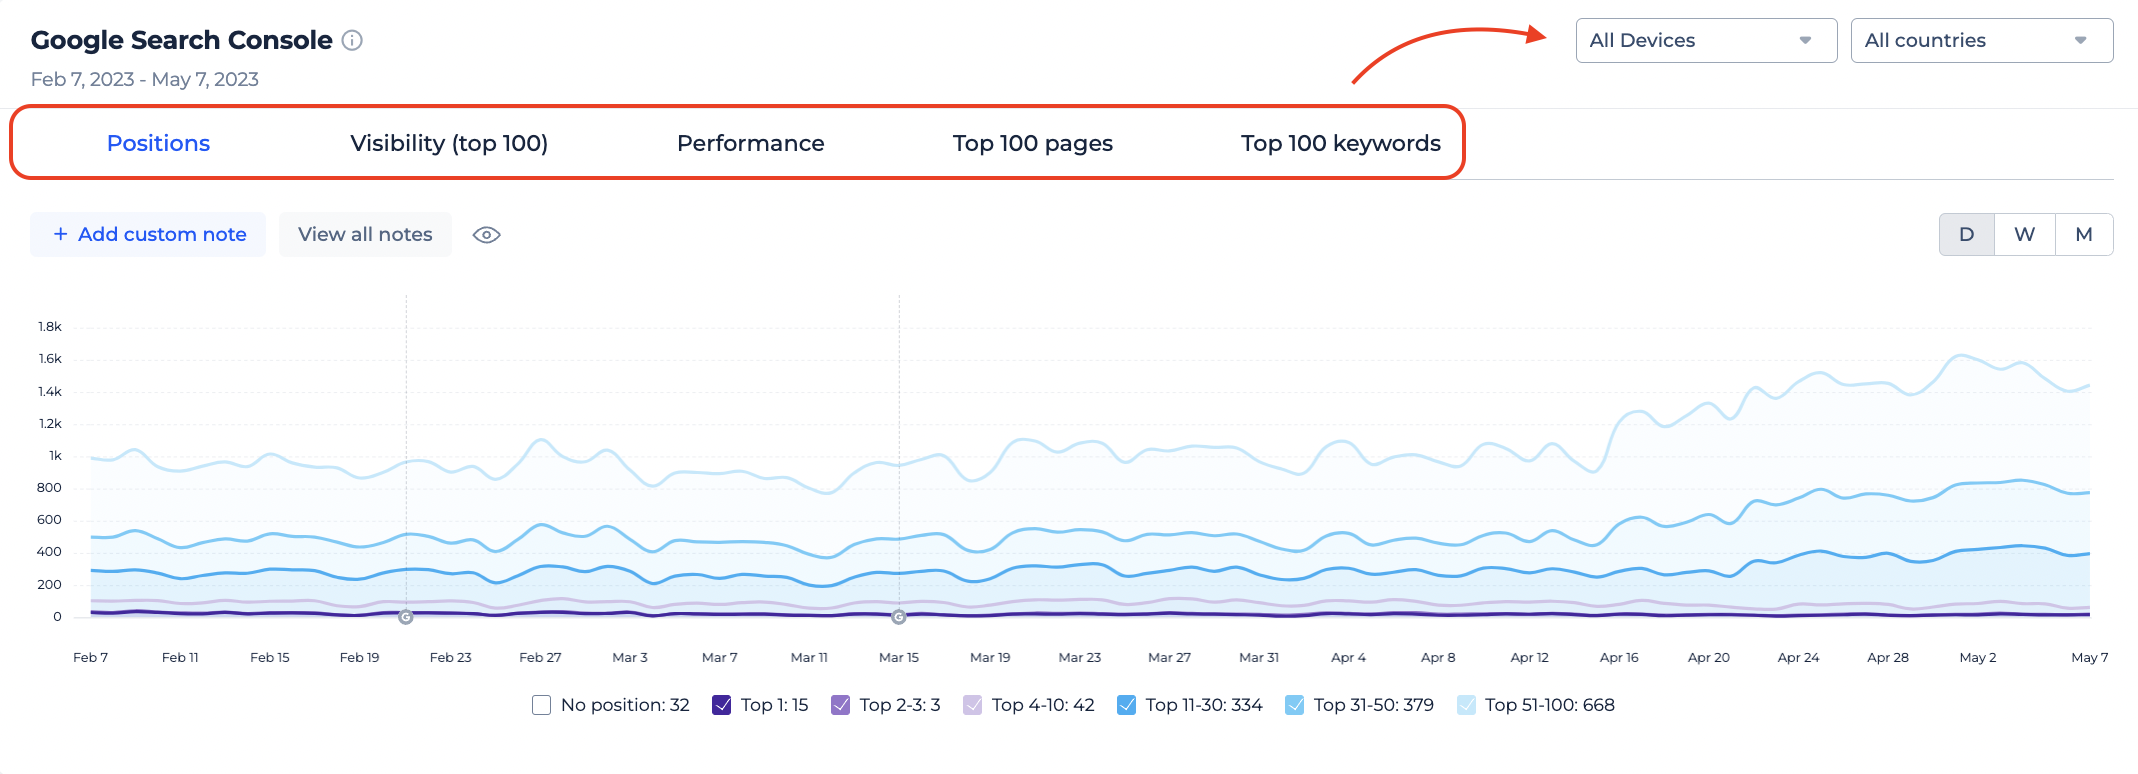
You can also see the new metrics Ranked Pages and Ranked Keywords that are based on the Google Search Console data. Such graphs are unique and they are not available directly in GSC.
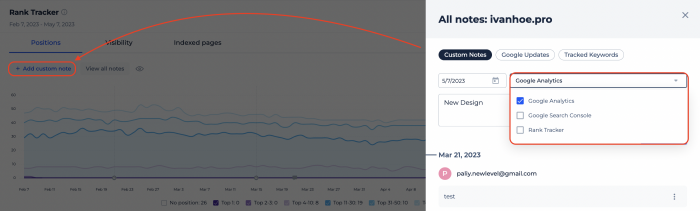
Custom notes on all graphs
This update brings you the possibility to add custom notes on all the graphs on the Dashboard. Just click on the button and add the note. The note can be added to all the graphs at once.