
How to use Page Segments report in GSC Insights
The Page Segments report in Sitechecker GSC Insights compares the search performance of different parts of your website.
A segment is a group of pages, for example your blog, product pages or one country folder. The report shows how each segment grows and what share of your traffic it brings.
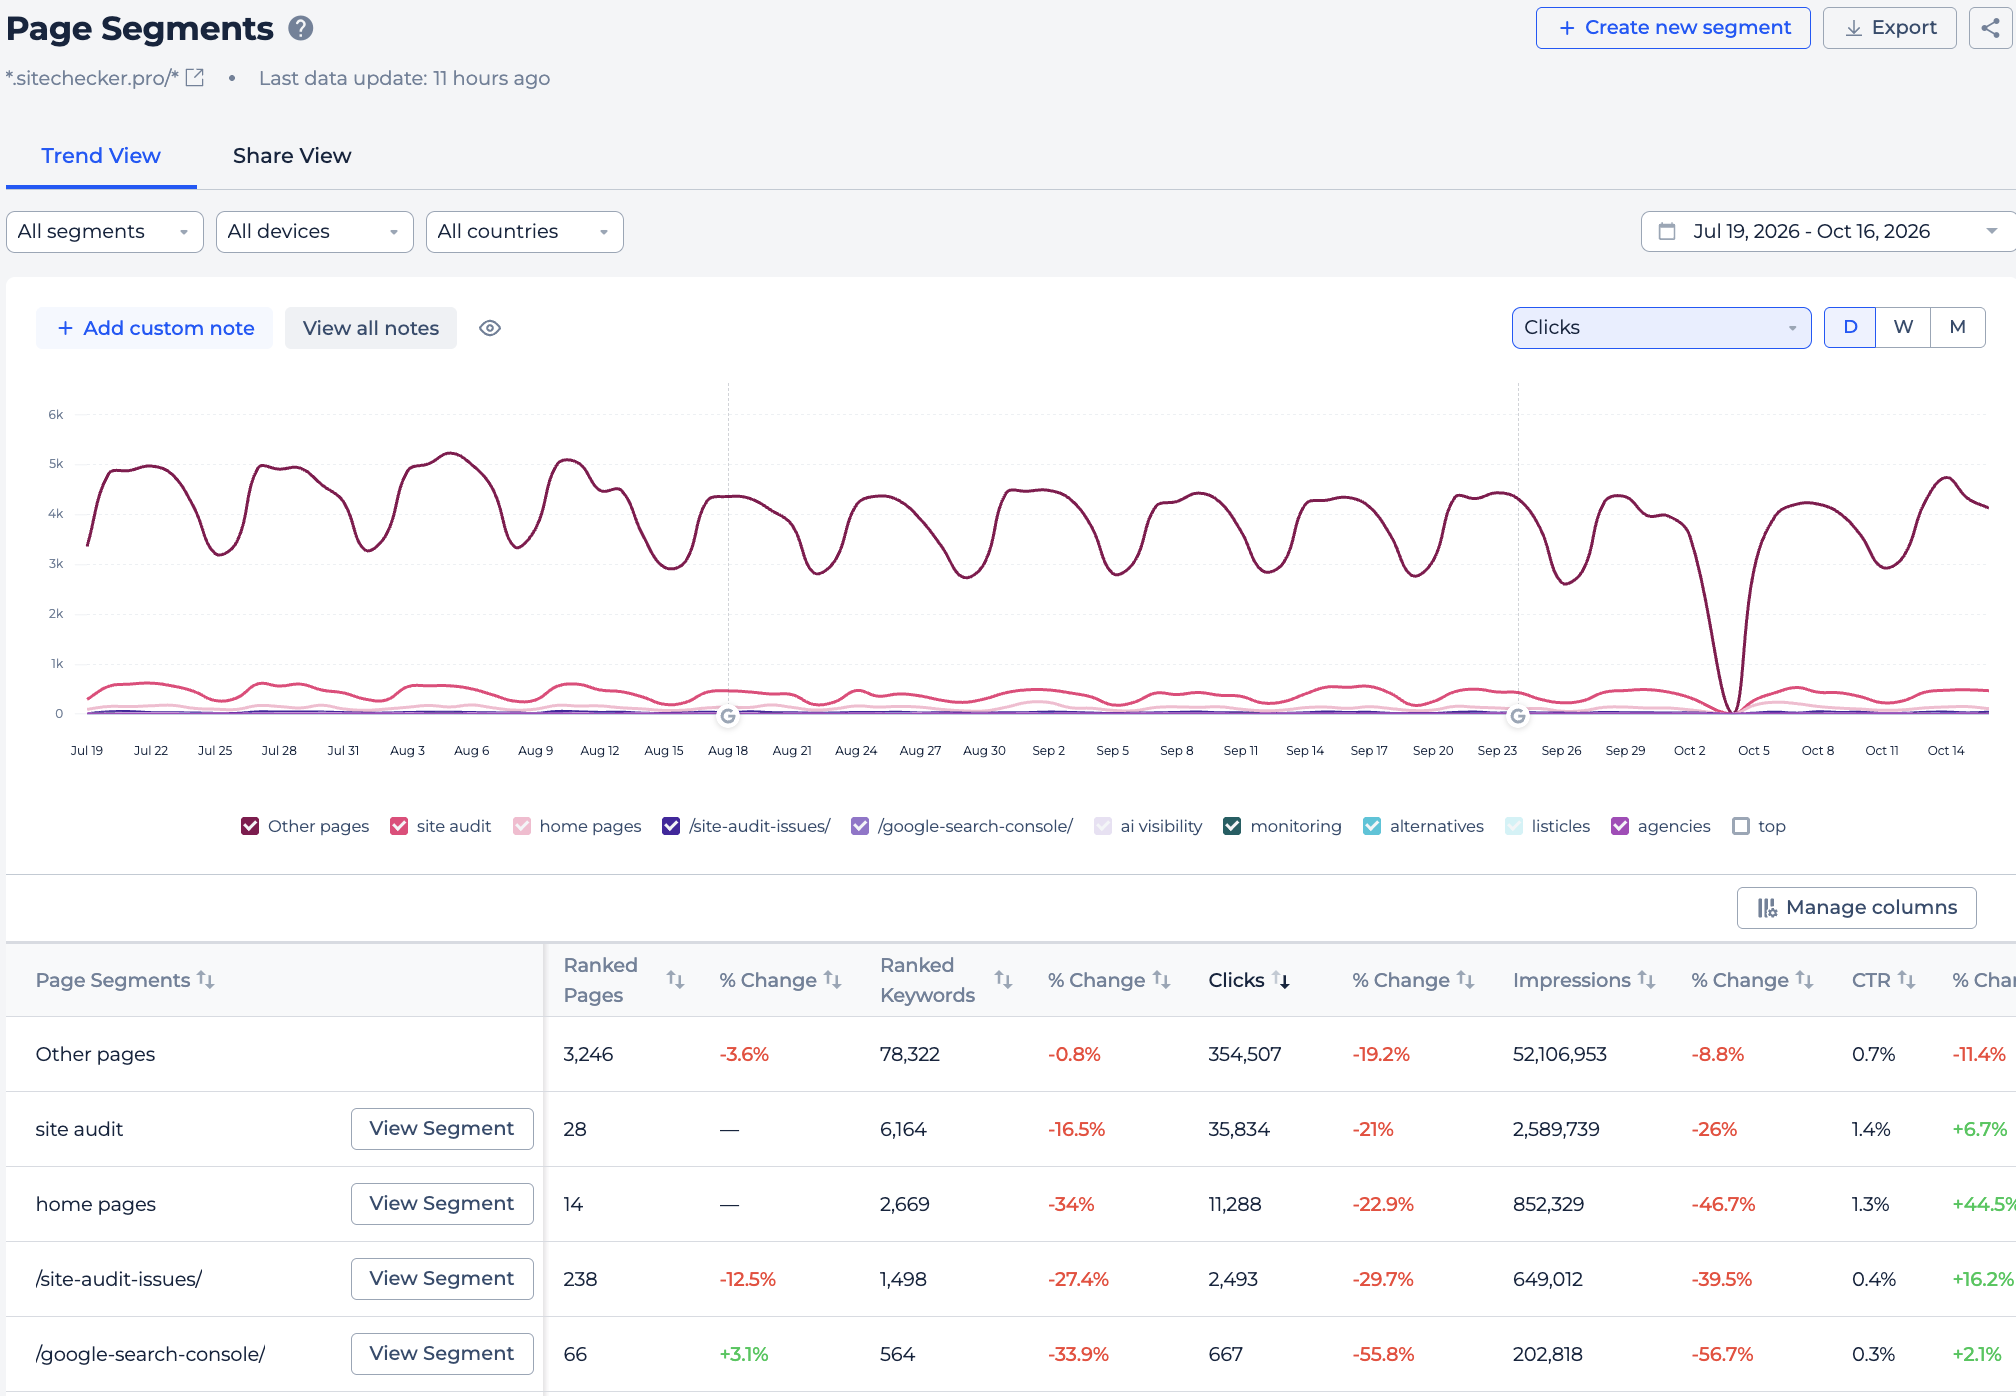
What you can do with Page Segments
- Compare clicks, impressions, CTR, position, ranked pages and ranked keywords between segments.
- See each segment's share of your total clicks, impressions and pages.
- Find the sections of your site that grow or fall behind.
- See the pages that do not belong to any segment as Other pages.
- Jump from a segment to the Overview report filtered by it.
Before you start
Connect Google Search Console to your project and create at least one segment.
Click Create new segment in the report header. You can build a segment with rules, with a list of URLs, or with a regular expression for the page URL. If you have no segments yet, the report shows a button to create one.
How it works
Sitechecker takes your Search Console data for every page and adds it up by segment.
Pages that do not match any of your segments go into Other pages, so you always see the full picture. Other pages is a system segment, so it cannot be edited.
The date picker compares your period with the previous one. Device and country filters apply to all segments.
Trend view
Trend view shows one line per segment on the chart. You can switch the chart between search metrics, ranked pages and ranked keywords.
Up to 10 lines can be on the chart at once. If you turn on another one, the first one turns off.
The table below lists every segment with its ranked pages, ranked keywords and search metrics, and the change for each. Click View Segment to open the Overview report with that segment applied.
Share view
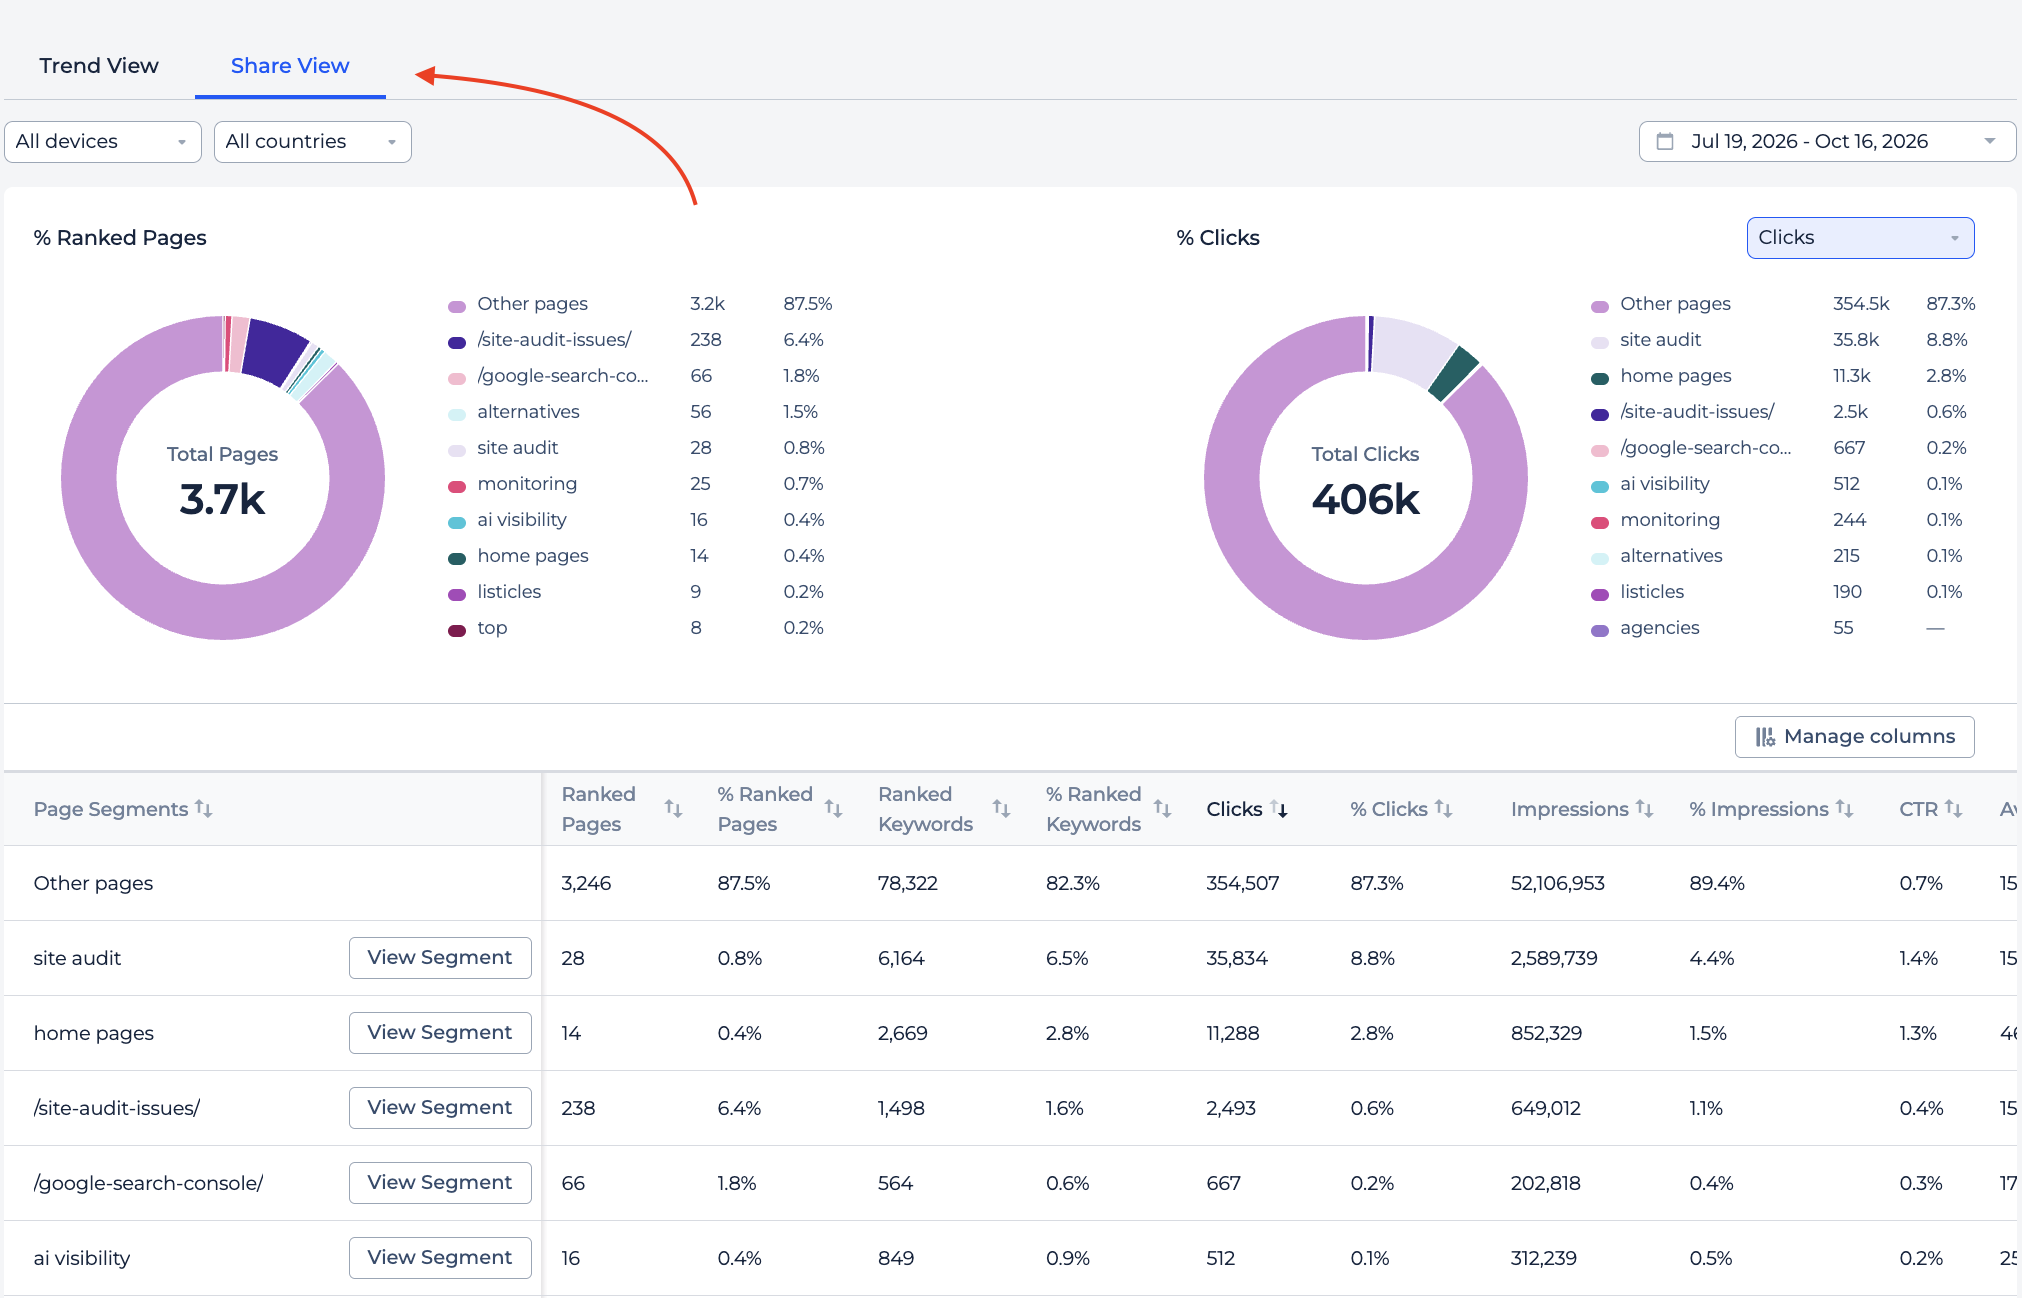
Share view shows two pie charts. The first one shows each segment's share of your pages. The second one shows the share of clicks, impressions or ranked keywords.
The table shows each metric with its share of the total. CTR and Position do not have a share, because they are averages.
How to use it in practice
- Create segments that match how your site is built, such as blog, categories, products and landing pages.
- Check Share view once a month. If one segment holds most of your pages but brings few clicks, it may need better content or internal links.
- Use Trend view after a Google update to see which section of your site was affected.
Frequently asked questions
What does the Page Segments report show? It compares the search performance of groups of pages and shows each group's share of your traffic.
What is Other pages? It is a system segment with all pages that do not match any of your own segments.
How do I create a segment? Click Create new segment and build it with rules, a list of URLs or a regular expression.
How many segments can I see on the chart at once? Up to 10. Turning on another segment turns off the first one.
Why do CTR and Position have no share? They are averages, so a share of the total does not make sense for them.
Need help?
If you have questions about the Page Segments report, write to us at support@sitechecker.pro. We are happy to help.